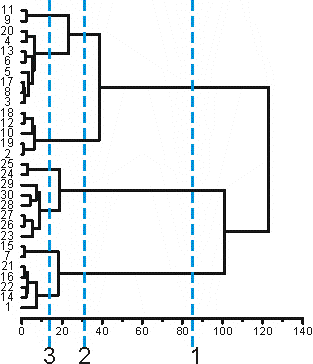
Cluster Validation
Validation of the cluster analysis is extremely important because of its somewhat 'artsy' aspects (as opposed to more scientific).
Validation at this point is an attempt to assure the cluster analysis is generalizable to other cells (cases) in the future. The following are some different ways to do this.
Analyze Separate Samples of Cells
Here you would collect data on one group of cells (or cases of whatever you're clustering) and perform the cluster analysis. Following this you would collect more data from from more cases and perform cluster analysis on these as well. Then the profiles of these two cluster analyses could be compared (See Profiling here).
Seeing as most of us aren't likely to do this the next best thing is to randomly split the sample that you have into multiple groups (most likely 2).
To see how to do this random sampling validation in SPSS click here.


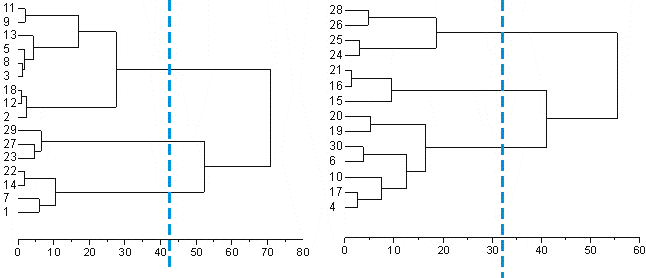
The idea here is to look and see if individual cases seem to cluster together the same way in the smaller samples as they do when all of the cases are used to perform the cluster analysis.
Here you can see that in the first dendrogram that 1, 7, 14 & 22 stay together. So do 23, 27 & 29. 2, 12, 18, 3, 8, 5, 13, 9 & 11 do as well.
In the second dendrogram 4, 17, 10, 6, 19 & 20 stay together. However 30 is added to this group as well. How much should this cause worry? Not very much, because as you may remember this cell has already been identified as being different from the cells by being GFP -ve. This reveals a problem with this in that cluster analysis (like statistical procedures) is better with a larger sample. I think this is still pretty good because the other groups stay consistent as well (I'm not listing them). Actually only 1 out of 30 cases switching groups is pretty good.
This isn't the end though.
| All Cells | Random Group1 | Random Group2 | ||||||
| Mean | SD | Mean | SD | Mean | SD | |||
| APHW | 1.169999 | 0.063714 | 1.15126 | 0.054225 | 1.194983 | 0.078289 | ||
| AHP | -3.95691 | 0.663658 | -4.06826 | 0.672651 | -3.80845 | 0.764708 | ||
| Rn | 348.7486 | 29.24746 | 338.9068 | 37.50931 | 361.8709 | 1.950505 | ||
| Mtau | 59.45319 | 1.169999 | 59.213 | 2.223075 | 59.77344 | 5.525621 | ||
| Axis | 1.690207 | 0.694995 | 1.658925 | 0.887908 | 1.731917 | 0.511781 | ||
| AMPA | 73.86707 | 4.621209 | 75.27751 | 5.12071 | 71.98649 | 3.930735 | ||
| EPSC | -375.027 | 10.11532 | -373.195 | 12.1766 | -377.469 | 8.300786 | ||
| APHW | 1 | 0.041259 | 1.003677 | 0.034747 | 0.963541 | 0.094942 | ||
| AHP | -2.2686 | 0.689125 | -2.23252 | 0.696048 | -2.22001 | 0.728748 | ||
| Rn | 423.7855 | 27.23804 | 419.0135 | 31.55001 | 423.4358 | 26.70377 | ||
| Mtau | 58.03932 | 26.85176 | 57.24916 | 27.81466 | 53.64329 | 29.43713 | ||
| Axis | 0.852383 | 0.47475 | 0.680997 | 0.483726 | 1.170366 | 0.360181 | ||
| AMPA | 74.22653 | 5.641363 | 75.28617 | 6.28192 | 72.71064 | 4.179569 | ||
| EPSC | -299.893 | 9.826026 | -298.168 | 11.50212 | -307.562 | 14.78337 | ||
| APHW | 0.800001 | 0.059242 | 0.81761 | 0.086448 | 0.792325 | 0.051527 | ||
| AHP | -1.89115 | 0.911236 | -1.92848 | 0.402861 | -1.93501 | 1.340819 | ||
| Rn | 318.7753 | 34.37174 | 307.753 | 40.99336 | 312.1387 | 16.47762 | ||
| Mtau | 20.15375 | 0.805265 | 20.42457 | 1.190181 | 19.95015 | 0.663389 | ||
| Axis | 1.464665 | 0.696058 | 1.92403 | 0.598264 | 1.102363 | 0.710041 | ||
| AMPA | 76.94796 | 4.892007 | 80.92229 | 4.746457 | 74.91617 | 3.83655 | ||
| EPSC | -375 | 22.2961 | -382.256 | 29.14978 | -378.794 | 8.166388 | ||
Looking at the profiles of the cells from the different samples you can see that there isn't much difference in the means. Of course you could (and should) carry out some statistical tests to see that they are not significantly different.
You can also plot this out as seen in the descriptive profiles to verify that there are no differences.
Use Other Hierarchical Clustering Procedures
This is a bit of a tricky one seeing as part of cluster analysis is picking the right clustering algorithm. Picking another one seems to go against that logic. However, the methods are sometimes similar enough and if your data has been picked and adjusted correctly (see here for picking and adjusting data) they should come out pretty similar if the cluster differences are robust.
Apply a Non-Hierarchical Cluster Procedure
Predictive Validity
Predictive validity is to use some variable not used in your original cluster analysis that has previously been established as varying among cases.